
Home > Research > Research Results > Research Results 2019 > Model for Evaluating and Mapping the Biodiversity of Planted Forests
Update:July 12, 2019
Main content starts here.
Model for Evaluating and Mapping the Biodiversity of Planted Forests
| Article title |
A spatially-explicit empirical model for assessing conservation values of conifer plantations |
|---|---|
| Author (affiliation) |
Yuichi Yamaura (a) (b) (c), David Lindenmayer (c), Yusuke Yamada (d), Hao Gong (d), Toshiya Matsuura (d), Yasushi Mitsuda (e), Takashi Masaki(b) (a) Shikoku Research Center, FFPRI, Kochi, Japan. (b) Department of Forest Vegetation, FFPRI, Tsukuba, Ibaraki, Japan. (c) Fenner School of Environment and Society, Australian National University, Canberra, Australia. (d) Department of Forest Management, FFPRI, Tsukuba, Ibaraki, Japan. (e) Faculty of Agriculture, University of Miyazaki, Miyazaki, Japan. |
| Publication Journal |
Forest Ecology and Management 444:393-404, July 2019 DOI:10.1016/j.foreco.2019.04.038( External link ) |
| Content introduction |
Planted forests are globally expanding and currently account for 7% of global forests. The conservation of biodiversity in such forests is considered necessary for the prevention of biodiversity loss. For instance, the volume (basal area) of indigenous broad-leaved trees growing in forests where conifers have been planted is considered a good indicator of biodiversity. This volume is referred to as the “naturalness index.” We investigated the influence of environmental factors on the rate of increase in the naturalness index as stands age using statistical methods, and developed a model for evaluating biodiversity levels in planted forests. An analysis of Japanese National Forest Inventory data revealed that the types of trees planted had the most influence on the rate of increase in the naturalness index as stands age, with the rate of increase in Japanese cedar (Cryptomeria japonica) and Japanese cypress (Chamaecyparis obtusa) plantations being low and the rate of increase in plantations of the other major types of trees being relatively higher. The next most important factor influencing the rate of increase was stand density. The lower the stand density, the higher the rate of increase in the naturalness index. Other key factors influencing the rate of increase in the naturalness index were snow depth and temperature. We created a naturalness index forecast map using a statistical model we developed based on the findings (Figure 1). According to our results, the types of species planted, which greatly influence the naturalness index, and forest management, which influences stand density, both considerably influence biodiversity in planted forests. In addition, as the model we developed employs factors that can easily be obtained from geographical information and field surveys, it is relatively easy to develop naturalness index models and maps. Therefore, the model could be globally employed in forests with different types of trees and different cutting cycles.
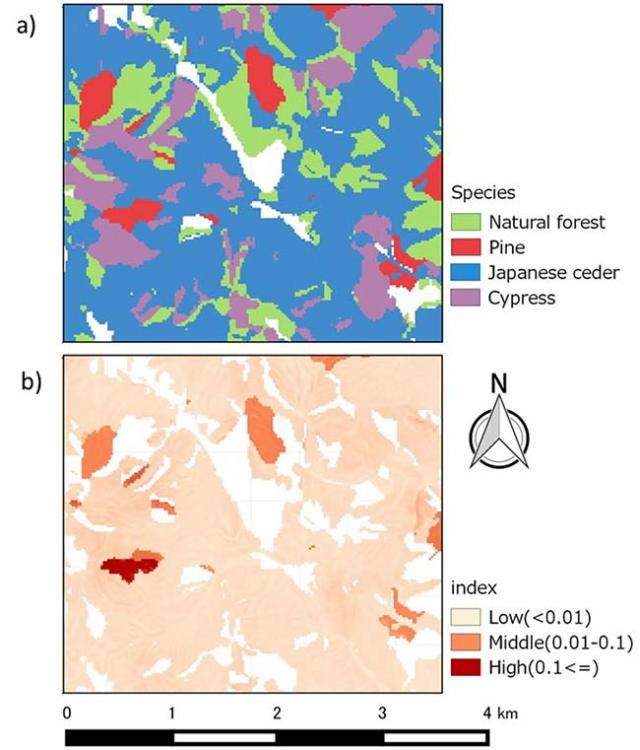
Figure1. Naturalness index forecast map for planted forests in northern Ibaraki Prefecture. a) Areas for which maps were created are shown based on forest type. Planted forests are color-coded according to planted species (land use other than forestry is indicated in white). b) Biodiversity mapping was only performed for planted forests (areas other than planted forests are indicated in white). The developed model used existing tree species and stand age to forecast the volume of broad-leaved trees growing in planted forests. The forecast volumes of broad-leaved trees were standardized on a 0–1 scale, which was referred to as the “naturalness index.” In several cases, the naturalness index was high in Japanese red pine plantations. In such areas, the naturalness index was mainly determined using the planted tree species. |
Copyright © Forest Research and Management Organization. All rights reserved.